Calculate the spatial distribution by a raster masked by shape/model grid information.
Examples
shape <- raster::shapefile(paste(system.file("extdata", package = "EmissV"),
"/BR.shp",sep=""),verbose = FALSE)
shape <- shape[22,1] # subset for Sao Paulo - BR
raster <- raster::raster(paste(system.file("extdata", package = "EmissV"),
"/dmsp.tiff",sep=""))
grid <- gridInfo(paste(system.file("extdata", package = "EmissV"),"/wrfinput_d02",sep=""))
#> Grid information from: /home/runner/work/_temp/Library/EmissV/extdata/wrfinput_d02
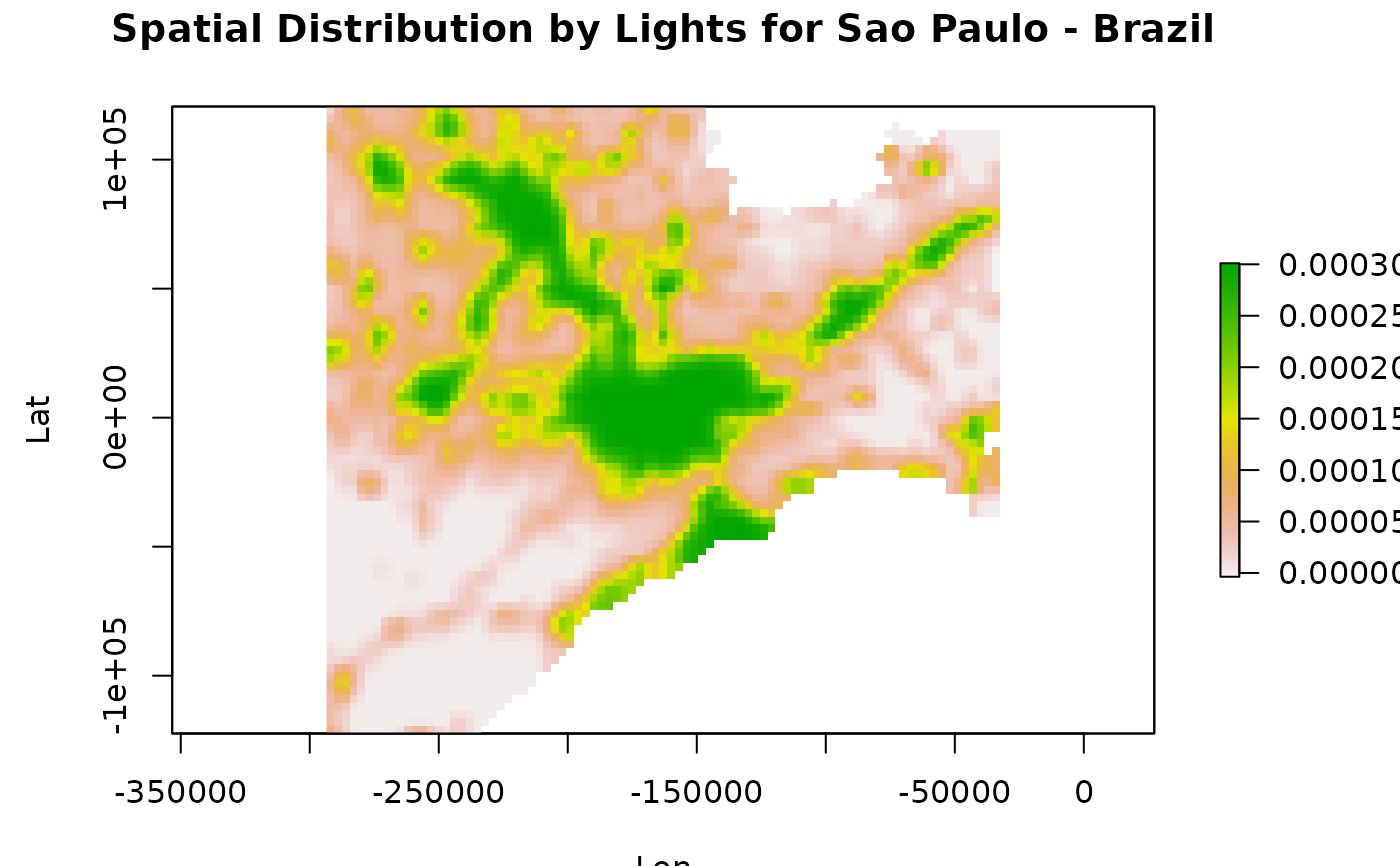
SP <- areaSource(shape,raster,grid,name = "SPMA")
#> processing SPMA area ...
#> fraction of SPMA area inside the domain = 0.473725382341265
# \donttest{
raster::plot(SP,ylab="Lat",xlab="Lon",
main ="Spatial Distribution by Lights for Sao Paulo - Brazil")
 # }
# }