Calculate the spatial distribution by a raster
See also
gridInfo and lineSource
Examples
grid <- gridInfo(paste(system.file("extdata", package = "EmissV"),"/wrfinput_d01",sep=""))
#> Grid information from: /home/runner/work/_temp/Library/EmissV/extdata/wrfinput_d01
x <- raster::raster(paste(system.file("extdata", package = "EmissV"),"/dmsp.tiff",sep=""))
test <- rasterSource(x, grid)
#> Grid output: 99 columns 93 rows
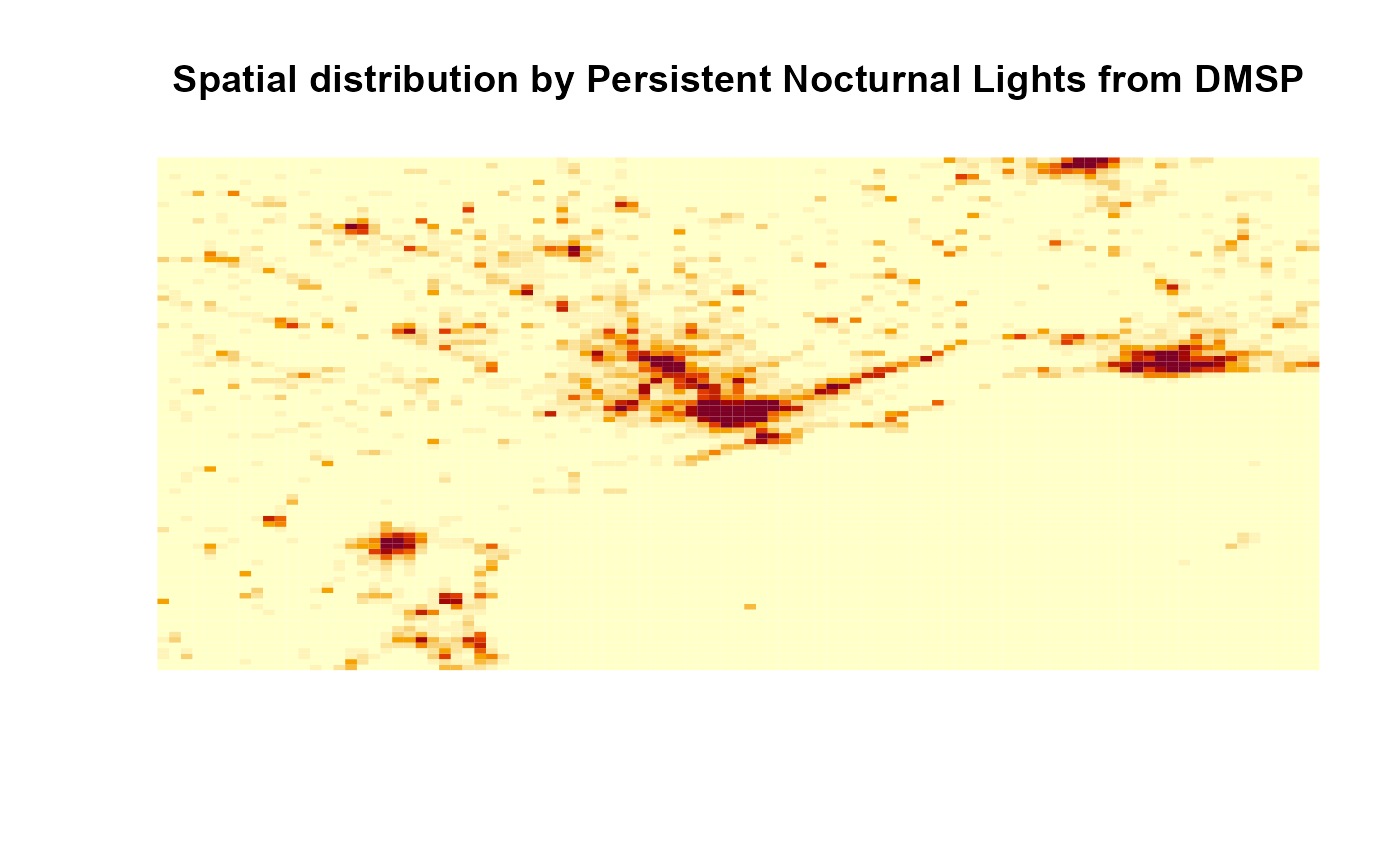
image(test, axe = FALSE, main = "Spatial distribution by Persistent Nocturnal Lights from DMSP")