Create a quick plot from wrf emission file
wrf_plot(
  file = file.choose(),
  name = NA,
  time = 1,
  nivel = 1,
  barra = T,
  lbarra = 0.2,
  col = cptcity::cpt(n = 20, rev = T),
  map = NULL,
  skip = FALSE,
  no_title = FALSE,
  verbose = TRUE,
  ...
)
Arguments
- file
emission file name
- name
pollutant name
- time
time from emission file
- nivel
level from the emission file
- barra
barblot if TRUE
- lbarra
length of barplot
- col
color vector
- map
function call to plot map lines, points and annotation (experimental)
- skip
logical, skip plot of constant valuess
- no_title
no title plot
- verbose
if TRUE print some information
- ...
Arguments to be passed to plot methods
Note
If the file contains levels (kemit>1), and one frame (auxinput5_interval_m = 1) time with control the level which will be ploted
In case of an error related to plot.new() margins lbarra must be adjusted
See also
Lights, to_wrf and wrf_create
Examples
{
dir.create(file.path(tempdir(), "EMISS"))
wrf_create(wrfinput_dir = system.file("extdata", package = "eixport"),
wrfchemi_dir = file.path(tempdir(), "EMISS"))
# get the name of created file
files <- list.files(path = file.path(tempdir(), "EMISS"),
pattern = "wrfchemi",
full.names = TRUE)
# load end write some data in this emission file
data(Lights)
to_wrf(Lights, files[1], total = 1521983, name = "E_CO")
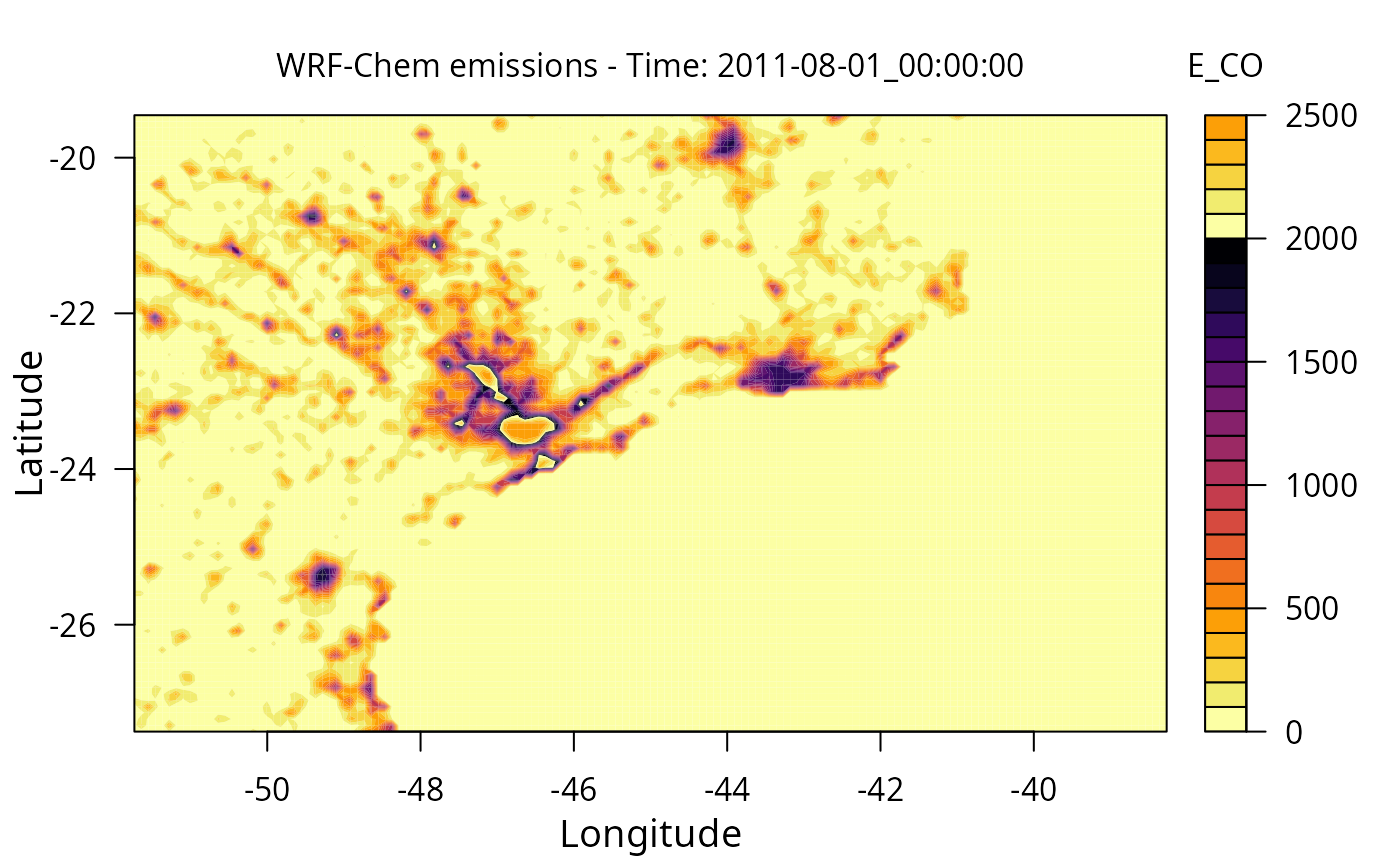
wrf_plot(files[1], "E_CO")
}
#> Warning: '/tmp/Rtmp1IAn5y/EMISS' already exists
#> creating emission for domain 1 ...
#> output file: /tmp/Rtmp1IAn5y/EMISS/wrfchemi_d01_2011-08-01_00:00:00
#> writing emissions: E_CO weight 1 on file /tmp/Rtmp1IAn5y/EMISS/wrfchemi_d01_2011-08-01_00:00:00
#> [1] "Times" "XLAT" "XLONG" "E_ACET" "E_ALD2" "E_ALDX" "E_ALK3"
#> [8] "E_ALK4" "E_ALK5" "E_BALD" "E_CCOOH" "E_CO" "E_CRES" "E_ECC"
#> [15] "E_ECI" "E_ECJ" "E_ETH" "E_ETHA" "E_ETOH" "E_FORM" "E_GLY"
#> [22] "E_HCL" "E_HCOOH" "E_IOLE" "E_IPROD" "E_ISOP" "E_MACR" "E_MEK"
#> [29] "E_MEO2" "E_MEOH" "E_MGLY" "E_NH3" "E_NO" "E_NO2" "E_NO3C"
#> [36] "E_NO3I" "E_NO3J" "E_OLE" "E_ORGC" "E_ORGI" "E_ORGJ" "E_PAR"
#> [43] "E_PHEN" "E_PM10" "E_PM25I" "E_PM25J" "E_PROD2" "E_PSULF" "E_SO2"
#> [50] "E_SO4C" "E_SO4I" "E_SO4J" "E_TERP" "E_TOL" "E_XYL"
#> /tmp/Rtmp1IAn5y/EMISS/wrfchemi_d01_2011-08-01_00:00:00
#> E_CO:
#> Max value: 2481.08618164062, Min value: 0