Speed returns a transformed object with class "Speed" and units
km/h. This function includes two arguments, distance and time. Therefore,
it is possible to change the units of the speed to "m" to "s" for example.
This function returns a data.frame with units for speed. When this function
is applied to numeric vectors it adds class "units".
Speed(x, ..., dist = "km", time = "h")

# S3 method for class 'Speed'
print(x, ...)

# S3 method for class 'Speed'
summary(object, ...)

# S3 method for class 'Speed'
plot(
  x,
  pal = "mpl_inferno",
  rev = FALSE,
  fig1 = c(0, 0.8, 0, 0.8),
  fig2 = c(0, 0.8, 0.55, 1),
  fig3 = c(0.7, 1, 0, 0.8),
  mai1 = c(1, 0.82, 0.82, 0.42),
  mai2 = c(1.8, 0.82, 0.5, 0.42),
  mai3 = c(1, 1, 0.82, 0.2),
  bias = 1.5,
  ...
)
Arguments
- x
Object with class "data.frame", "matrix" or "numeric"
- ...
ignored Default is units is "km"
- dist
String indicating the units of the resulting distance in speed.
- time
Character to be the time units as denominator, default is "h"
- object
Object with class "Speed"
- pal
Palette of colors available or the number of the position
- rev
Logical; to internally revert order of rgb color vectors.
- fig1
par parameters for fig,
par.- fig2
par parameters for fig,
par.- fig3
par parameters for fig,
par.- mai1
par parameters for mai,
par.- mai2
par parameters for mai,
par.- mai3
par parameters for mai,
par.- bias
positive number. Higher values give more widely spaced colors at the high end.
Value
Constructor for class "Speed" or "units"
Note
default time unit for speed is hour
See also
Examples
{
data(net)
data(pc_profile)
speed <- Speed(net$ps)
class(speed)
plot(speed, type = "l")
pc_week <- temp_fact(net$ldv+net$hdv, pc_profile)
df <- netspeed(pc_week, net$ps, net$ffs, net$capacity, net$lkm)
summary(df)
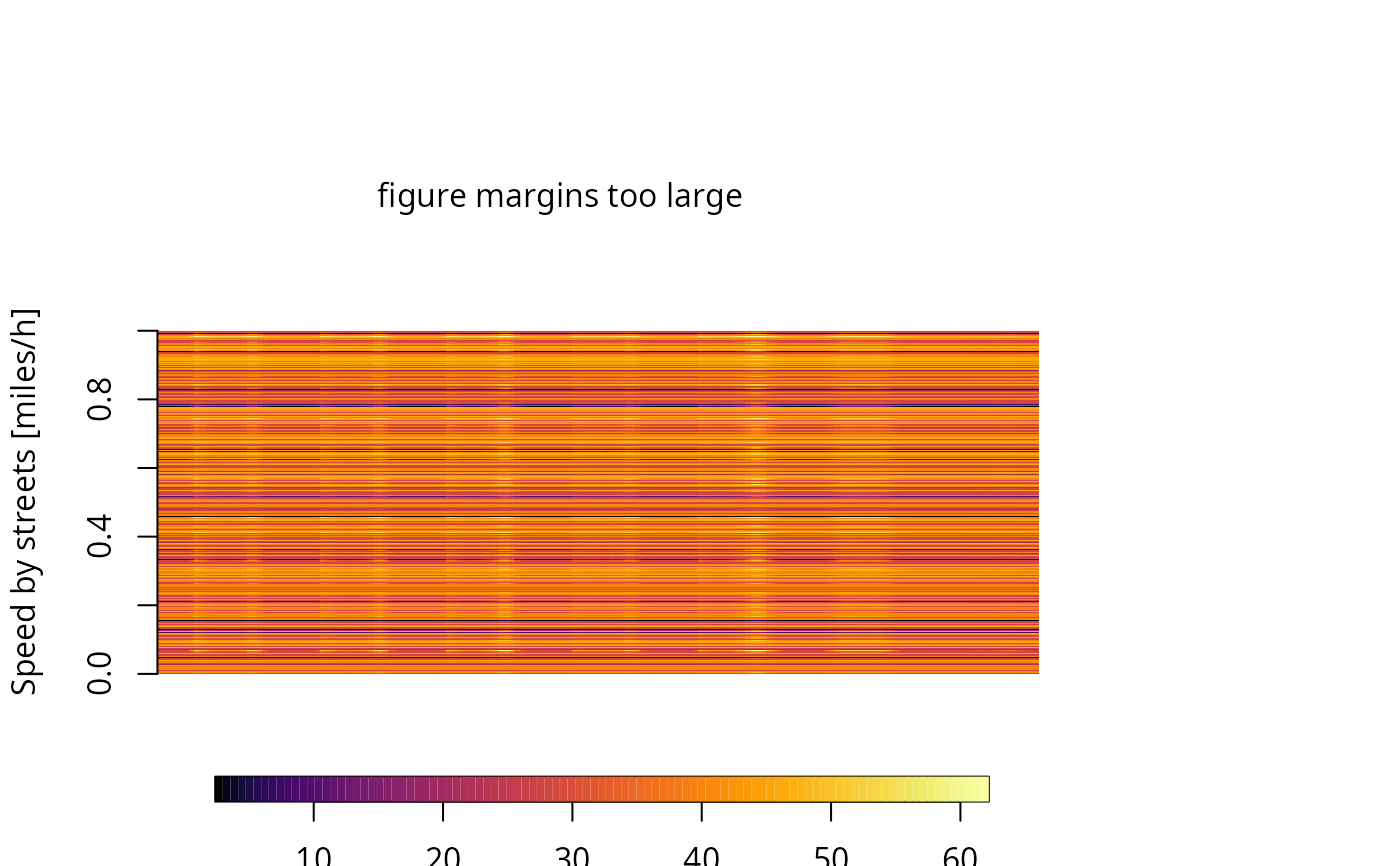
plot(df)
# changing to miles
net$ps <- units::set_units(net$ps, "miles/h")
net$ffs <- units::set_units(net$ffs, "miles/h")
net$lkm <- units::set_units(net$lkm, "miles")
df <- netspeed(pc_week, net$ps, net$ffs, net$capacity, net$lkm, dist = "miles")
plot(df)
}
#> Units are the same and no cerversions will be made
 #> Speeds by columns and street in study area =
#> Min. 1st Qu. Median Mean 3rd Qu. Max.
#> 3.929 39.667 40.000 49.142 59.985 100.000
#> Weighted mean = 49.14
#> Speeds by columns and street in study area =
#> Min. 1st Qu. Median Mean 3rd Qu. Max.
#> 3.929 39.667 40.000 49.142 59.985 100.000
#> Weighted mean = 49.14
 #> Weighted mean = 30.54